When you first start using Wireshark you will find that the great folks at Wireshark provide us with a “Default” profile. This is where we all started. We will call this our Zero starting point. Here is what it looks like:
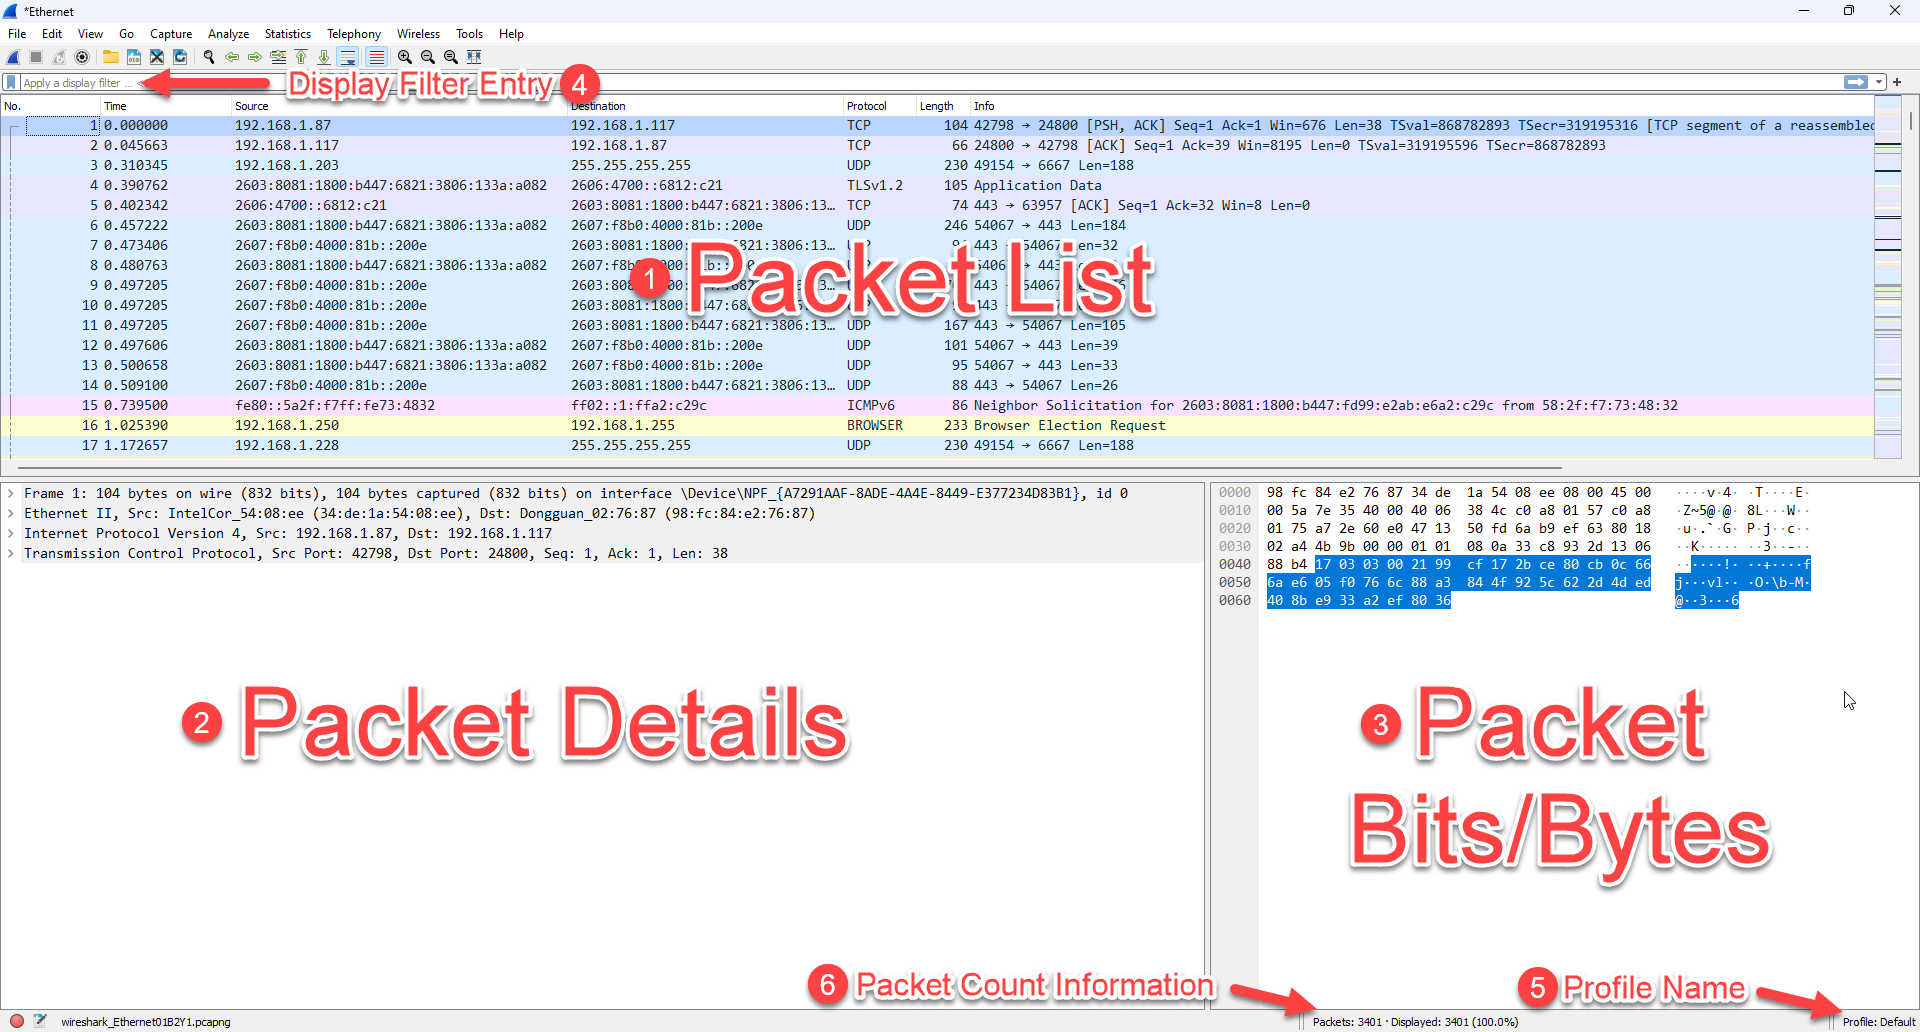
That default, whilst a great starting point leaves much to be desired as your experience with Wireshark grows, and even arguably from day one.
It is not long before you are wondering what else we can add and what else is important to troubleshooting a given packet capture. The truth is, there is a lot that can be customized with Wireshark. In this article, I am going to focus on Wireshark’s columns.
First, a couple of things about the columns. Clicking on any column header causes Wireshark (like a spreadsheet) to sort on that column. You can see below, #1 – I clicked on the Protocol column, and then #2 – I clicked on the “Go to the first packet” button in the tool bar, and #3 – I note a little up arrow appeared on the column indicating that the column is sorted in ascending order:

Clicking the title of the column a second time with resort, this time descending order and the arrow will change to the downward direction indicating the order of the sort.
Now, the immediate concern is that the number order of the packets has changed, so to return the packet list to the usual number order, we simple click on the No. column to sort in ascending order, and then that handy button to jump to the top of the list, and we are back to the normal view of the packet list.
You can imagine that sorting based on column content could be quite helpful when looking for a particular protocol, or a particular source or destination address. In the end the sort is perhaps not specific enough, but this is a good starting point.
The Default Columns
In the default profile there are seven columns. Let’s discuss what the contents are of these seven columns:
- No. This is the number of the packet in the capture. It will always start with one, and count upward. This is essentially the order in which packets were captured. Can packets get out of order? Sure, however we will discuss this is a different article. If one was to apply some sort of display filter, then this column will show which number match your filter.
- Time. This is one of the timestamps wireshark tracks for each packet. This particular timestamp is a reference of time from the first packet in the capture. It is a good and quick way to view the packet list in a timeline perspective. That said, this leaves a lot to be desired. There is a section to follow where we will dive into how we can use other timestamps and how we can modify this column.
- Source. Simply this is either a) the Source IP address of the packet, or b) the Source MAC address of the packet, or it is left blank if neither of those can be decoded. Layer 3 is preferred over Layer 2, but if there is no Layer 3, like in an ARP packet, the Layer 2 address will be displayed.
- Destination. This column behaves much like the Source column, expect this time it is either a) the Destination IP address of the packet, or b) the Destination MAC address of the packet, or it is left blank if neither of those can be decoded. Layer 3 is preferred over Layer 2, but if there is no Layer 3, like in an ARP packet, the Layer 2 address will be displayed.
- Protocol. This column appears somewhat arbitrary at first. It is not. Wireshark attempts to find the highest layer protocol when it decodes the contents of a packet, and then places that protocol type in this column. For example this may be UDP or TCP, or even QUIC. Usually after those protocols, data is encrypted, so you will not see HTTP. So if you want to know how much web browsing traffic there is, filtering for ‘http’ or ‘https’ may not show as many packets as say filtering for ‘tcp.port==80’ as an example. The content here is also affected by what protocol dissectors are enabled or disabled (you can enable of disable certain protocol dissectors in the Analyze> Enabled Protocols drop down menus).
- Length. At first glance, this seems simple: it is the size of each packet, right? Well that would be close. When a packet is captured on your machine, it is process by the Network Interface (often called a NIC). So the packet is processed by the NIC before it is sent into the system’s protocol stack. Wireshark gets a ‘sniff’ of that packets once it has arrived in the protocol stack. So if the NIC does something like check the Frame Check Sequence (FCS) (4 bytes) and then remove that information, that is not seem in the Wireshark display, and importantly for this column, those bits and bytes are not included in the Length column. When NICs do this they usually also remove the Ethernet preamble (1 byte) as well. You can see that this column represents what Wireshark sees is the length of the packet, and depending on the capture device, not the actual number of bits that were transmitted on the physical media. It’s OK. In the end, we usually end up looking at things like Maximum Transmission Unit (MTU) size, or Maximum Segment Size (MSS) as issues, and not necessarily the true length of a given packet/frame.
- Info. Think of this column as an attempt by the Wireshark program to provide summary information of what this particular packet is about. For the most part, the program does this very well. However, sometimes, this information is not helpful, or cannot be helful for a number of reasons. The content is dependent of the highest level up the protocol stack that Wireshark can decode, like the Protocol column. It is also dependent, just like the Protocol column, of what protocol dissectors are enabled. More on that later.
Adding and Modifying the Columns – A Start
Great. So what if we want to add columns, or move columns or change columns? All great questions that if we want to be a hero, we need to be able to answer.
As packet content appears in multiple packets of a capture (think Window Size in TCP, how much time has passed between captured packets, or power levels in Wireless LAN headers) sometimes one wants of needs to add columns in the packet list to more easily view changes from one packet to the next, extracting this information from the decoded packets.
Adding this information is really easy to do, and there are multiple methods to do so. Lets start with enhancing how we can view time.
We already have a time column that shows, on a packet by packet basis how much time has elapsed since the first packet. You can reset that default “reference point” by simply selecting any packet, hitting CTRL-T to toggle the time reference, or right clicking on the packet and select “Set time reference”. Repeat the process to toggle it off. Here is a silent demo:
Now let’s enhance this running time column with what I have always felt should be a default column – delta time – meaning how much time has passed since the prior packet being displayed. Luckily, Wireshark stores several of these important time calculations in the Frame information. To see this expand the Frame info, and then look for the three Time related calculations that Wireshark makes for every packet:
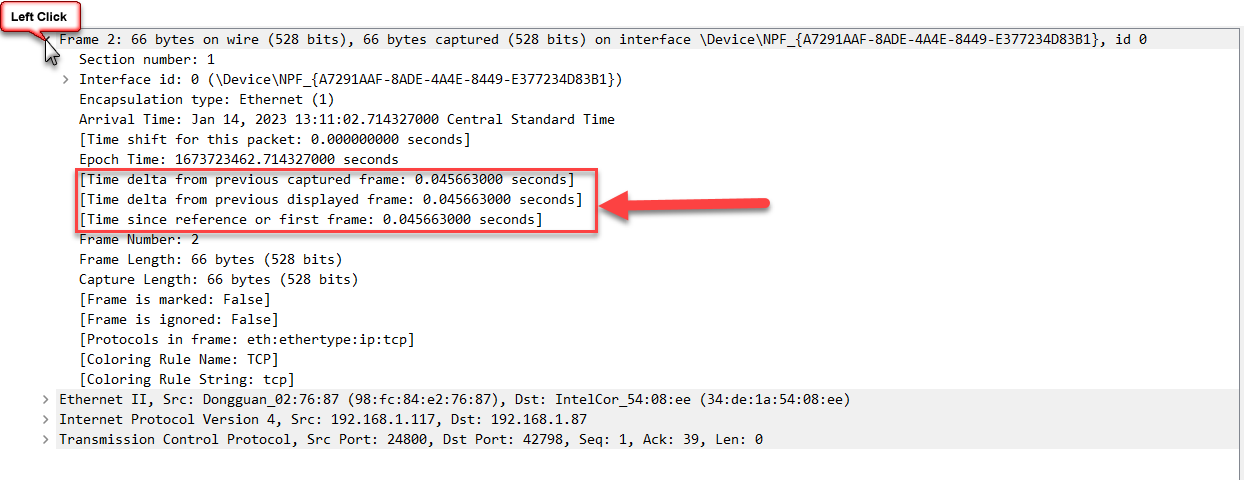
The last of the three is the Time column we already have. The other two are delta times, meaning the difference in time between the current packet and the prior packet. One is like a fixed value based on all the packets. But the second one is the one we want as this adjust based on what is displayed. Meaning that if you apply a display filter this delta time will adjust to show the time since the prior displayed packet. This way it is always the delta time of what we are looking at.
OK, so lets add this as a column. We have several ways to do this. One is to click on this time delta item and drag it up onto the packet list area. Another method is to right click on that item, and then select “Apply as a column”. Don’t worry if you get it wrong, you can simply select the column heading, right click and select “Remove column” to undo the mistake. Here is a little demonstration:
Did you notice that when I dragged and dropped, the column went where I wanted it. When I used the right click method, the column was added ahead on the info column and then I had to select the column header and drag it where I wanted. Keep in mind this may be way off to the right of your current view.
If you look at what we just did, all is well, expect that the title of the column is too long and the width of the column is too wide. To modify the column, right click on the column header and select Edit column from the pop up menu. You can then make changes. Here is what I did to modify the column:
There is a third way to add, change, and move columns. It is is the Wireshark Preferences, under Appearance, and Columns. Here you can add, delete, select and deselect columns to view, as well as change their order and edit their content, all from one place. In the little demonstration below, I will repeat the adding and editing of the Delta Time column using this method. I will start by deleting the column and then re-installing it. Note that I will have to know the name of the field to insert. In this case it is ‘frame.time_delta_displayed’ and I got this from the Edit column information previously. The point here is you have to know what Wireshark calls these items to work in this screen. Here is the silent demonstration:
Great!
So far we have learned all the basics of Wireshark columns. We are definitely no longer a Zero. But what about some advanced column capabilities? This is where we can go to Hero!
Which Address?
In the default columns, Wireshark tries to give us the source and the destination addresses as we discussed earlier. But what if we have a GRE tunnel, or an IPv6 inside IPv4 tunnel? Which address will be displayed? This is a great question, and the ambiguity of multiple addresses such as in tunneled packets is something we need to have control over.
Luckily Wireshark supports this notion through something called “Field Occurrence”, meaning that Wireshark is aware that something like a source address can occur multiple times. To be more specific, there are several things we need to do. First, we need to tell Wireshark that the item we want in our column is a Custom type. Then we will need to be specific as to what address is being displayed in the column.
Let’s look at a packet we call a Protocol 41 tunnel (IPv6 inside IPv4). We see in #1 I am filtering for Protocol type 41 packets, and in #2 and #3 that Wireshark has displayed the source and destination addresses of the tunneled packet (IPv6 addresses) not the IPv4 source and destination. You can also see this in the packet details in #4 and #5. Again, in these standard columns, Wireshark is attempting to dig as deep as it can.
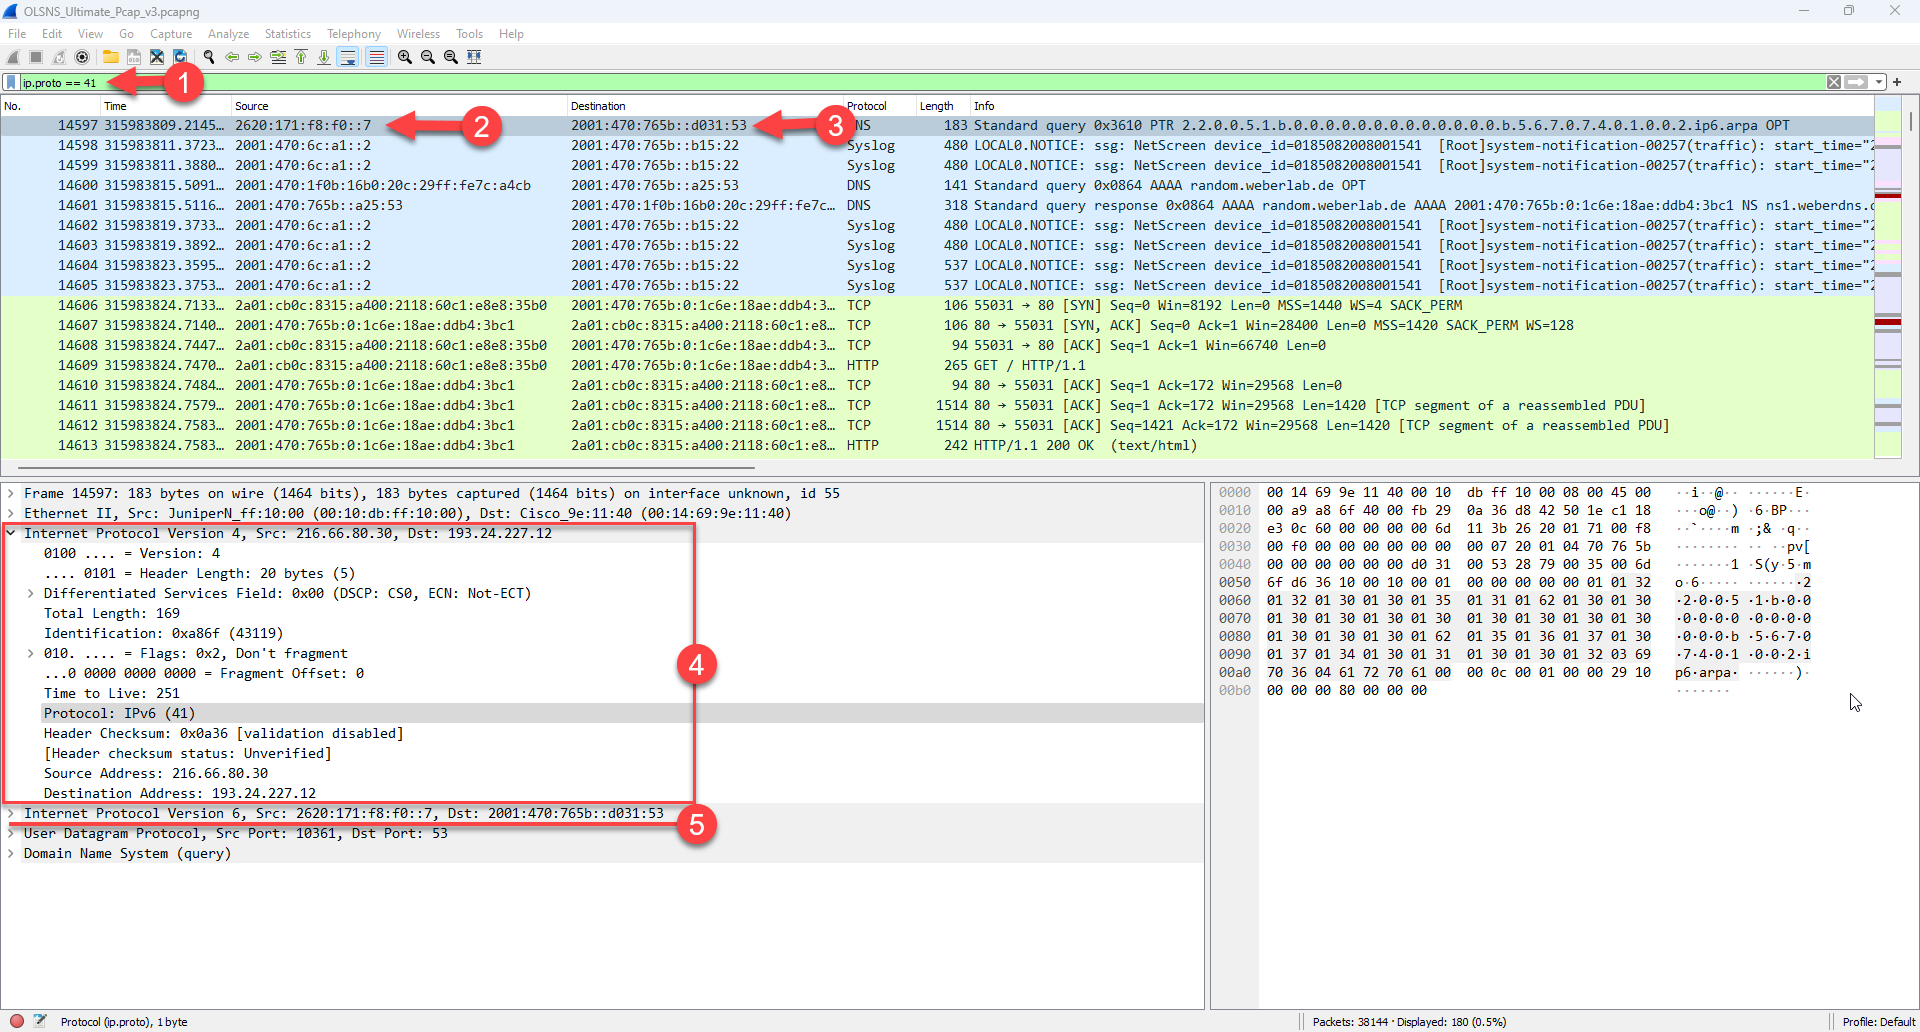
If I want a more specific set of columns that show the Tunnel vs. the tunneled sources and destinations, I must customize the columns and add these custom columns. Here is a silent demonstration of me doing this, and note as I go that I am right clicking on the addresses and adding them as columns and the system automatically selects Custom and the occurrence is set to 0 which actually shows all occurrences’. I probably should have set these to 1 to show the first occurrence. If you select 2 it would be the second occurrence, etc. Also note that right at the end of the demonstration I hide the original Source and Destination columns so I do not confuse myself:
Now let’s look at the same problem with GRE tunnels where we will have two IPv4 addresses. We see below that the default Source and Destination fields are selecting the tunneled packet Source and Destination.
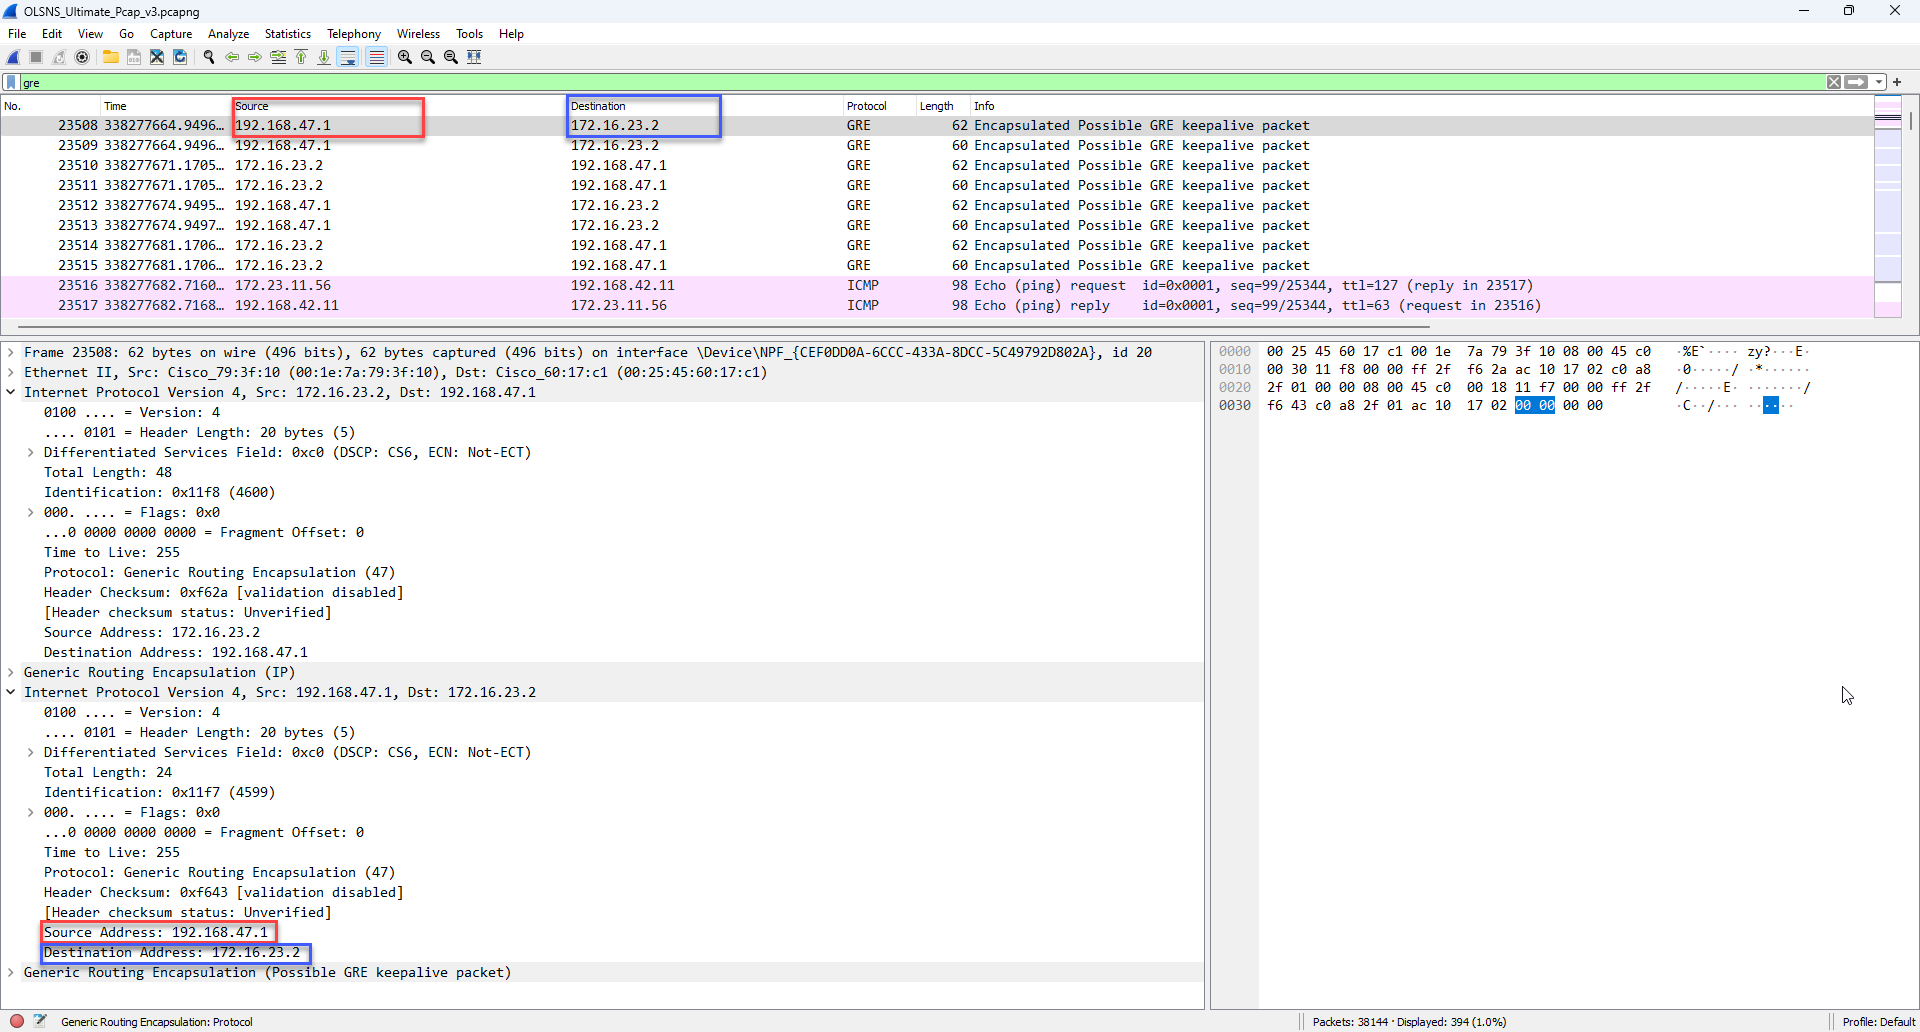
So in the next silent demonstration, I will follow the same process, but you will see that when I add the new custom columns that both addresses are displayed in the column, So now I will be specific as to the first and the second. There is an interesting side note here that at the time of this writing is what I would call a quirk in Wireshark. Wireshark does not like when you try to right click and add two columns that have similar names/fields, however, using the Preferences> Columns method, and manually adding the second item works. So watch me as I do this silently:
Some items, Wireshark resolves the number in a field of the protocol to something we can read. For example, in IPv4 the Protocol field is a value, and Wireshark resolves this to the definition of that value from the RFC standard:
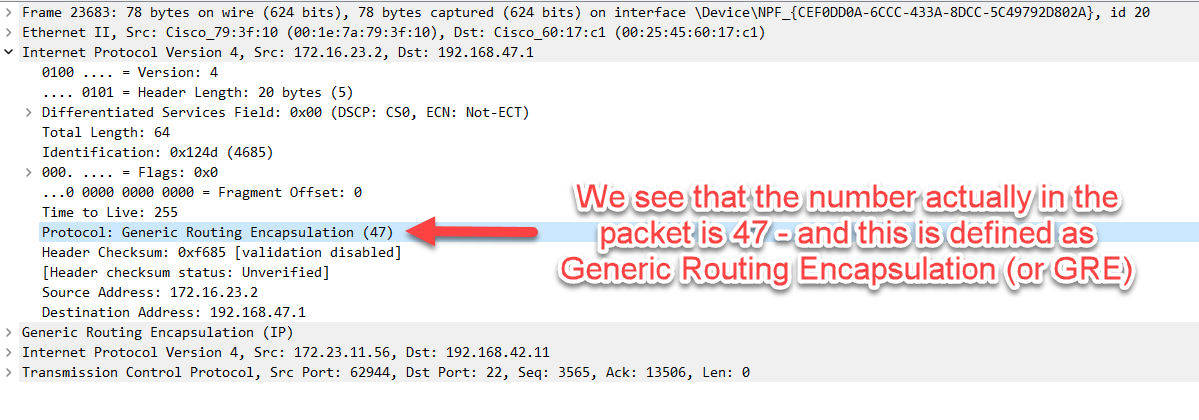
If we try to add this item as a column, we will get the resolution words, not the number:
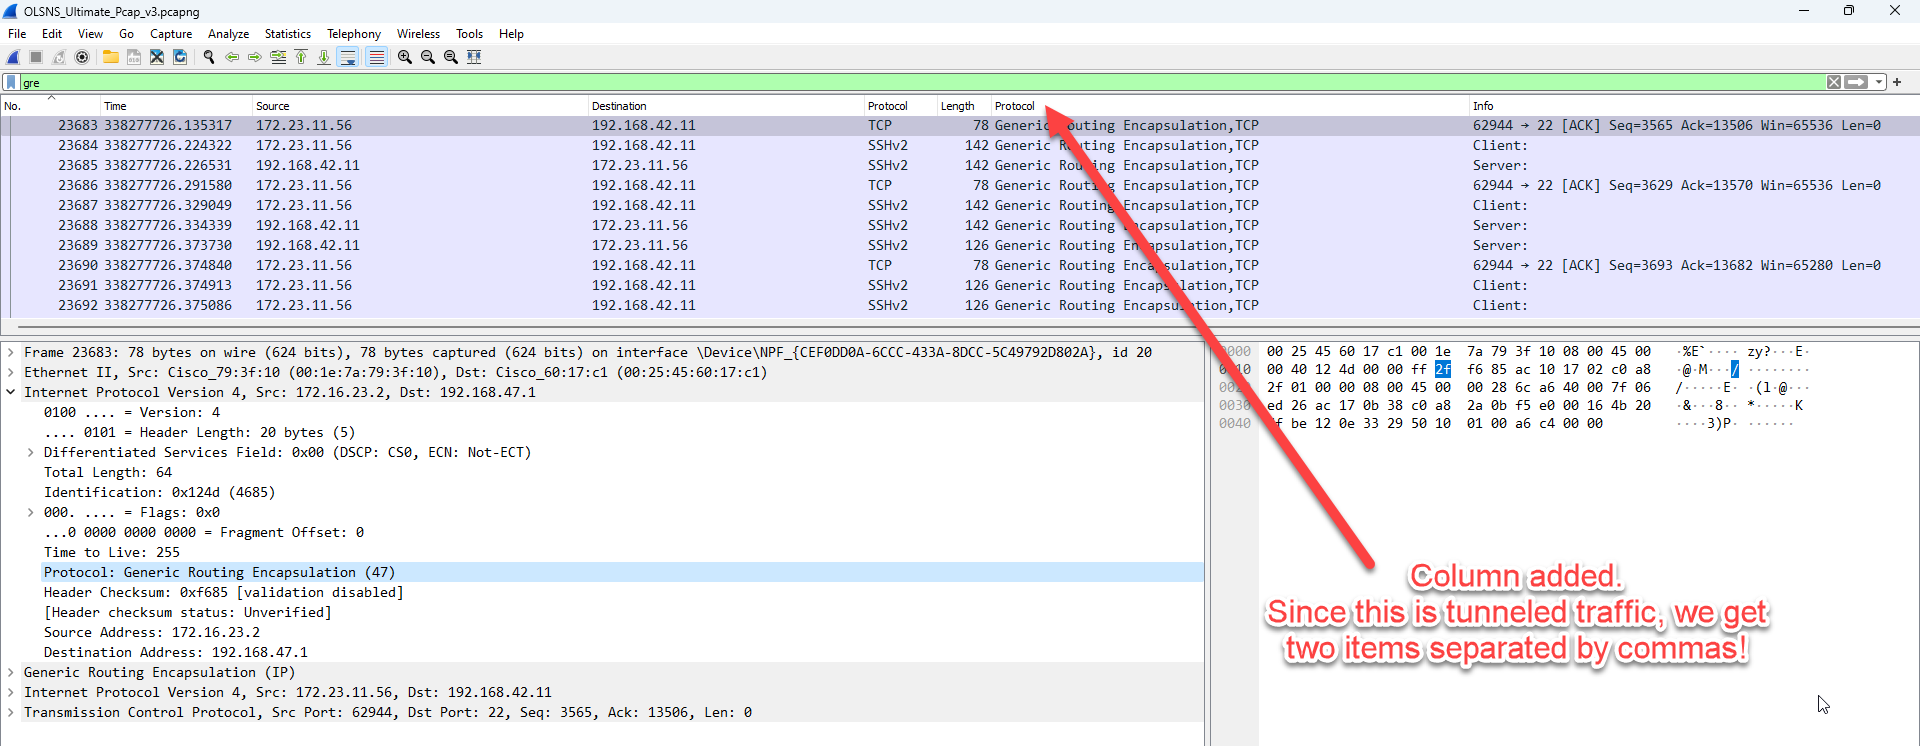
So once again, we need to edit the column, this time selecting the correct occurrence and then further turning off the resolve names so we can see the numbers as shown in this silent demonstration:
I hope this article has taken you from Zero to Hero on Wireshark columns.
Be sure to check out our Wireshark Profiles here: https://www.cellstream.com/wireshark-profiles-repository/
Comments are welcomed below from registered users. You can also leave comments at our Discord server.
If you would like to see more content and articles like this, please support us by clicking the patron link where you will receive free bonus access to courses and more, or simply buying us a cup of coffee!
